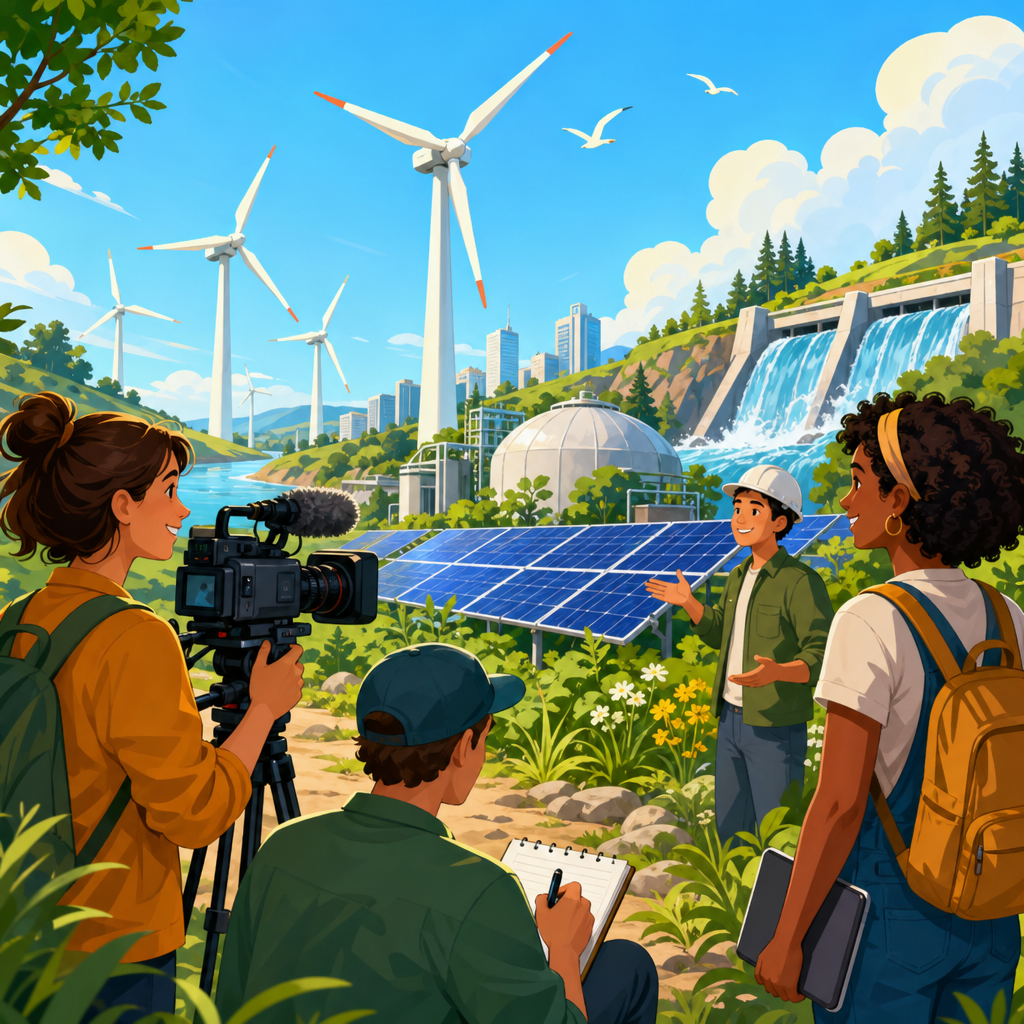

Ecological footprint tools help students and educators measure how daily choices affect land use, energy demand, water systems, and carbon emissions, turning abstract sustainability lessons into evidence-based learning. In schools, colleges, museums, and informal learning programs, these interactive tools and calculators make environmental impact visible by converting behaviors such as transportation, food consumption, device use, and purchasing into understandable metrics. An ecological footprint generally estimates the biologically productive land and sea area needed to supply resources and absorb waste, while related classroom tools may also track carbon footprint, water footprint, waste generation, or household energy use. I have used these tools in lesson planning and workshops, and their value is immediate: students engage faster when they can compare a bus commute with a car trip, or a plant-based lunch with a beef-based meal, using real numbers instead of slogans. This matters because sustainability education works best when learners can connect systems thinking to their own routines. A strong hub page on interactive tools and calculators should therefore explain which tools exist, how they differ, how to use them responsibly, and where each fits within curriculum design, assessment, and student-led action.
What Ecological Footprint Tools Actually Measure
Not every ecological footprint calculator measures the same thing, and that distinction is essential for educators choosing resources. Some tools estimate a full ecological footprint in global hectares, based on consumption categories such as food, housing, goods, and mobility. Others focus narrowly on carbon dioxide equivalent emissions, often called carbon footprint calculators. A third group tracks water footprint, usually separating direct water use from embedded or virtual water in products and diets. Waste calculators, energy dashboards, and campus sustainability simulators add further layers. In practice, students often assume one score represents total environmental impact, but that is rarely true. A carbon calculator can show greenhouse gas consequences without capturing biodiversity loss, eutrophication, or land conversion. An ecological footprint model may estimate regenerative capacity pressures yet simplify local water scarcity. Good teaching starts by naming the metric, the unit, the boundaries, and the assumptions built into the model.
For example, the Global Footprint Network popularized a personal footprint approach tied to biocapacity and Earth Overshoot Day, which is useful for discussing planetary limits and resource demand. By contrast, the U.S. Environmental Protection Agency offers household-oriented tools and emissions guidance that are stronger for discussing energy efficiency, transport, and waste reduction in operational terms. The World Wildlife Fund has supported footprint-style engagement tools in several regions, often emphasizing lifestyle choices and comparative learning. University-based calculators may use region-specific electricity emissions factors, making them better for local accuracy in classroom projects. When I review tools for courses, I check whether they disclose data sources, update energy factors annually, and explain whether estimates are national averages or user-specific inputs. That simple review prevents one of the biggest classroom problems: students treating broad estimates as precise personal audits.
Core Categories of Interactive Tools and Calculators
Students and educators usually need a mix of tools rather than one universal calculator. Personal lifestyle calculators work well for introductory lessons because they are quick, visual, and relatable. Carbon calculators are better for quantifying travel, heating, electricity, and consumption scenarios in science, geography, and economics classes. Water footprint tools fit food systems, agriculture, and global trade discussions. Household energy simulators support STEM instruction because they connect appliance efficiency, insulation, lighting, and weatherization to measurable demand reductions. Waste and recycling calculators are effective in primary and middle grades, where visible materials flows make concepts concrete. Campus or school footprint tools are especially useful for project-based learning because they turn buildings, procurement, transportation, and cafeteria systems into real case studies.
Another important category is policy or scenario modeling tools. These let students test “what if” questions, such as what happens to emissions if a school replaces diesel buses, installs heat pumps, or shifts cafeteria purchasing toward lower-impact proteins. Scenario tools build systems literacy because they show tradeoffs, time horizons, and rebound effects. I have found that students move from passive concern to analytical thinking when they can compare interventions side by side. Instead of saying “solar is better,” they can estimate kilowatt-hour output, payback periods, and avoided emissions using local data. This type of calculator supports higher-order skills: interpreting variables, judging data quality, and defending conclusions. For a hub page in Education & Resources, the most useful framing is not simply a list of calculators, but a map of use cases tied to grade level, subject area, available class time, and desired learning outcomes.
How to Evaluate Tool Quality Before Using It in Class
Teachers should vet ecological footprint tools with the same care used for textbooks or lab resources. First, examine methodology transparency. A credible tool identifies what it measures, where data come from, what year the factors reflect, and how uncertainty is handled. Second, review geographic relevance. If a calculator uses average grid electricity emissions from another country, its results may mislead students studying local energy transitions. Third, assess usability and accessibility. The best classroom tools explain terms plainly, work on school-managed devices, load well on mobile connections, and avoid requiring unnecessary personal data. Fourth, look for pedagogical flexibility. Strong tools allow repeated use, comparisons, exportable results, or scenario adjustments rather than producing a single score and ending there.
Fifth, check whether the tool encourages action without oversimplifying responsibility. Some calculators imply that individual behavior alone solves systemic environmental challenges. That framing is incomplete. Responsible sustainability education shows both personal agency and structural factors such as transit access, housing stock, energy infrastructure, and food supply chains. I prefer tools that let students see limits as well as choices. For instance, a rural student without public transit options should not be treated as making the same transport decision as an urban student with rail access. Finally, verify privacy and advertising practices. Free tools sometimes collect emails, embed trackers, or steer users toward commercial products. In K–12 settings especially, privacy review matters as much as content accuracy. A calculator may be visually appealing yet unsuitable if it obscures methods or monetizes student data.
Best Classroom Uses Across Subjects and Grade Levels
Ecological footprint tools are versatile because they connect naturally to multiple disciplines. In elementary settings, simple calculators can introduce resource use, waste sorting, and daily habits through visual prompts and classwide comparisons. In middle school, footprint activities work well in earth science, geography, and civics because students can connect consumption to ecosystems, trade, and community infrastructure. In high school, they become more powerful when paired with emissions factors, lifecycle thinking, and spreadsheet analysis. College courses can go further, asking students to critique assumptions, compare methodologies, and build their own mini-models using published datasets.
One effective sequence starts with a personal footprint estimate, then moves to household data collection, then to institutional analysis. Students first reflect on their own choices, next investigate utility bills, transport logs, or cafeteria menus, and finally propose school-level interventions. In my experience, this progression reduces defensiveness and increases rigor. Learners stop seeing sustainability as a moral scorecard and start treating it as a design problem. Language arts teachers can use calculator outputs for persuasive writing and evidence-based argument. Math teachers can use them for percentages, rate conversions, graphing, and uncertainty discussion. Social studies teachers can examine environmental justice by asking why two households with similar values may have very different footprints due to income, housing quality, or transit availability.
Recommended Tool Types by Educational Goal
| Educational goal | Best tool type | What students learn | Example classroom application |
|---|---|---|---|
| Introduce sustainability basics | Personal ecological footprint calculator | Resource demand, overshoot, lifestyle categories | Compare food, housing, and travel choices in a one-period lesson |
| Quantify climate impact | Carbon footprint calculator | CO2e, emissions factors, sector comparisons | Estimate emissions from commuting, flights, and home electricity use |
| Teach food and agriculture systems | Water and diet impact calculator | Virtual water, land use, diet differences | Analyze weekly lunch menus and redesign them for lower impact |
| Support STEM problem solving | Energy simulator or building calculator | Kilowatt-hours, efficiency, insulation, payback | Model classroom lighting upgrades or HVAC improvements |
| Drive school action projects | Campus or institutional footprint tool | Systems thinking, procurement, transport, facilities data | Create a sustainability plan for the school or district |
Using Results Responsibly: Limits, Biases, and Common Misreadings
All footprint tools simplify reality. That does not make them useless; it means results need interpretation. Most consumer-facing calculators rely on average data for housing type, vehicle efficiency, diet composition, or regional electricity. Students who enter partial information may receive estimates that appear precise because they are displayed to one decimal place, but the underlying uncertainty can be substantial. Educators should explicitly teach that modeled outputs are approximations for comparison and decision support, not exact measurements. This is an ideal opening for discussing scientific models, confidence, and data quality.
Another common issue is moral overreach. A higher footprint score does not automatically mean a student is careless or uninformed. Family income, rental conditions, geography, disability, and local infrastructure all shape environmental choices. I always frame results around opportunity, constraints, and systems. If a calculator shows high transport emissions, the lesson should include urban design, transit policy, and vehicle standards, not only personal guilt. Likewise, a food calculator should recognize affordability, culture, and school meal access. Tools are strongest when they start conversations about leverage points. Students should learn which actions have large effects, which are symbolic, and which require collective action beyond the household level.
Building a Strong Hub for Interactive Tools and Calculators
As a sub-pillar hub under Education & Resources, this page should connect readers to more specialized content organized by task. Useful supporting articles include classroom-ready ecological footprint calculators, best carbon footprint calculators for students, water footprint tools for food education, school energy audit platforms, campus sustainability dashboards, and worksheet templates for interpreting results. Internal links should help users move from overview to implementation quickly. A teacher who lands here may need a five-minute activity, a standards-aligned lesson plan, or a districtwide project model. The hub should guide each path clearly.
It also helps to organize recommendations by audience and constraints. K–5 educators need visual, low-reading-level tools. Secondary teachers often need tools that support data export and comparative analysis. Higher education instructors may prefer calculators with published methodologies and configurable assumptions. Librarians, museum educators, and after-school coordinators often need low-login, multilingual resources that work on shared devices. By structuring the hub around these practical questions, the page becomes more than a broad introduction. It becomes a decision tool that saves time and increases the chance that the selected calculator will genuinely improve learning rather than add digital noise.
Choosing the Right Next Step for Your Classroom or Program
Ecological footprint tools for students and educators are most effective when they are chosen for a specific learning goal, explained with methodological honesty, and followed by meaningful reflection or action. The best interactive tools and calculators do not just produce a score; they help learners connect consumption, infrastructure, and environmental limits in ways they can test and discuss. Used well, they support science literacy, numeracy, civic understanding, and student agency all at once. Used poorly, they can confuse metrics, exaggerate precision, or individualize problems that are partly systemic.
The practical takeaway is simple. Start with the question you want students to answer, then choose the tool that measures that question most directly. Pair every calculator with context about assumptions, local conditions, and tradeoffs. Whenever possible, move from personal estimates to school or community data so students can identify realistic interventions. If you are building an education resource library, use this hub as the starting point and expand into dedicated guides for carbon calculators, water footprint tools, energy simulators, and campus assessment platforms. Select one tool, test it with a small group, and build your next lesson around evidence instead of abstraction.
Frequently Asked Questions
What are ecological footprint tools, and why are they useful for students and educators?
Ecological footprint tools are calculators, digital platforms, classroom activities, and assessment resources that estimate how human behavior translates into environmental demand. For students and educators, they are especially useful because they turn broad sustainability ideas into measurable, concrete outcomes. Instead of talking about energy use, transportation, food choices, or consumption in abstract terms, these tools show how specific habits can affect carbon emissions, land use, water systems, and resource demand. That makes environmental learning more immediate and easier to understand.
In educational settings, these tools support evidence-based learning. A student can compare the impact of biking to school versus riding alone in a car, or explore how dietary patterns, device usage, and shopping habits influence overall environmental pressure. Educators can use the results to prompt discussion, data analysis, goal setting, and problem solving. Because many ecological footprint tools present results visually through charts, categories, and comparisons, they also help learners identify which daily choices matter most and where practical changes can have the strongest effect. This combination of personal relevance and measurable data is what makes ecological footprint tools so powerful in classrooms, colleges, museums, and informal learning programs.
How do ecological footprint calculators measure everyday choices like food, travel, and technology use?
Ecological footprint calculators typically work by collecting information about common behaviors and then applying established environmental impact factors to estimate resource use and emissions. A user might enter how often they eat meat, how they commute, how much they fly, how much electricity they use, what types of products they purchase, or how often they replace electronics. The calculator then converts those behaviors into understandable indicators such as carbon emissions, energy demand, land area required, or broader ecological impact categories.
For students and educators, the key value is not only the final score but also the structure behind the calculation. Food choices may be linked to agricultural land use, water demand, fertilizer inputs, and transportation. Travel is often tied to fuel use, distance, and mode of transport, with public transit, walking, and cycling usually showing lower impacts than solo driving or frequent flying. Technology use can include the electricity needed to power devices, as well as the environmental costs associated with manufacturing, data use, and replacement cycles. Good educational tools make these relationships visible so learners understand that environmental impact comes from systems, not just isolated actions. This helps build systems thinking, which is essential for meaningful sustainability education.
How can teachers use ecological footprint tools in lessons without oversimplifying sustainability?
Teachers can use ecological footprint tools most effectively when they present them as learning instruments rather than perfect final judgments. A calculator result should be the beginning of inquiry, not the end of it. In practice, that means asking students to interpret results, compare categories, examine assumptions, and discuss what the tool may capture well or miss entirely. For example, a footprint estimate may reveal transportation as a major source of impact for one student, while food or purchasing stands out for another. That opens the door to deeper lessons about infrastructure, access, economics, and policy.
To avoid oversimplification, educators can pair footprint tools with broader concepts such as environmental justice, local ecosystems, consumption systems, and institutional responsibility. Students can explore why not everyone has the same transportation options, why food choices are influenced by cost and geography, or why schools themselves shape energy demand and waste generation. Teachers can also use the results for project-based learning, such as designing lower-impact school events, auditing classroom energy use, or proposing campus sustainability improvements. When used this way, ecological footprint tools help students connect personal behavior to larger environmental systems while recognizing that sustainability is shaped by both individual choices and collective structures.
Are ecological footprint tools accurate enough for academic and educational use?
Ecological footprint tools are generally accurate enough for educational use when they are applied appropriately, but they should be understood as estimates rather than exact measurements. Most tools rely on averages, standard datasets, and model assumptions to translate behaviors into environmental impact. That means they are very helpful for identifying trends, comparing choices, and illustrating relative differences, even if they cannot capture every local variable or personal circumstance. In a teaching environment, this level of accuracy is often more than sufficient because the goal is to support understanding, analysis, and behavior reflection.
What matters most is transparency. Strong educational tools explain what they measure, what data sources they rely on, and what limitations they have. For instance, one calculator may focus heavily on carbon emissions, while another includes land use, water consumption, or material demand. Some may not fully account for regional electricity grids, shared household resources, or the lifecycle impacts of products. Educators can turn these limitations into a valuable lesson by asking students to evaluate methodology, compare multiple tools, and think critically about environmental metrics. In that sense, ecological footprint tools are not just calculators; they are also opportunities to teach data literacy, model interpretation, and scientific reasoning.
What should students and schools do after calculating an ecological footprint?
After calculating an ecological footprint, the next step should be action informed by reflection. For individual students, that may mean identifying the one or two impact areas where change is most realistic and meaningful. If transportation is the largest category, they might explore carpooling, public transit, biking, or combining trips. If food is a major factor, they might examine food waste, packaging, or the environmental effects of different meal patterns. If technology or purchasing stands out, they can look at extending device life, buying less often, repairing items, or choosing secondhand products. The most effective changes are usually the ones that are consistent, realistic, and supported by the learner’s actual circumstances.
For schools and educational institutions, footprint results can guide broader sustainability planning. A class may use aggregate findings to identify common concerns and design group responses, such as improving recycling communication, reducing cafeteria waste, promoting active transport, or conducting an energy-saving campaign. Schools can also connect footprint data to science, geography, civics, and math by having students analyze trends, set reduction targets, and evaluate outcomes over time. This turns the footprint tool from a one-time activity into a framework for continuous learning and improvement. When students see that data can lead to real decisions and visible change, sustainability education becomes more practical, empowering, and durable.