Life cycle analysis of renewable resource technologies is the most practical way to compare clean energy claims with measurable environmental reality. In environmental science, life cycle analysis, often shortened to LCA, tracks impacts from raw material extraction through manufacturing, transport, operation, maintenance, and end-of-life treatment. Renewable resources are sources replenished on human timescales, including sunlight, wind, sustainably managed biomass, flowing water, and geothermal heat. Nonrenewable resources, such as coal, oil, natural gas, and uranium, are finite in accessible form or require geologic timescales to regenerate. When people ask whether renewable energy is truly cleaner than fossil energy, LCA provides the defensible answer because it examines the full system instead of only what happens at the power plant or fuel tank.
I have used life cycle thinking in environmental assessments, and the most common mistake I see is comparing technologies at different boundaries. A solar panel does not emit carbon dioxide while generating electricity, but silicon purification, aluminum frame production, glass manufacturing, and shipping all create upstream impacts. A coal plant emits heavily during operation, but mining, rail transport, ash disposal, and methane leakage also belong in the picture. The value of a hub article on renewable versus nonrenewable resources is that it gives a consistent framework for comparing climate emissions, land use, water demand, toxicity, materials dependence, reliability, and waste. Without that framework, public debates often reduce complex systems to slogans.
This topic matters because energy, materials, and ecosystems are tightly linked. Governments use life cycle analysis to shape procurement rules, vehicle standards, biofuel policy, and net-zero strategies. Companies rely on it for product declarations and supply chain decisions. Households encounter it when choosing rooftop solar, electric vehicles, heat pumps, or green power contracts. A careful analysis also avoids false binaries. Renewable technologies usually outperform nonrenewable systems on greenhouse gas emissions and air pollution, but they still have tradeoffs involving mining, habitat disturbance, recycling, and grid integration. Understanding those tradeoffs is essential for sound environmental science and credible resource management.
For this hub, renewable versus nonrenewable resources should be understood not as a morality play but as a comparative assessment across defined metrics. The central question is simple: over a full life cycle, which technologies deliver the most useful energy or service with the lowest total harm? The answer depends on functional unit, geography, technology generation, and management practices, yet major patterns are clear. Wind, solar, hydropower, and geothermal generally have far lower life cycle greenhouse gas emissions than coal and natural gas. Sustainable biomass can be low carbon in specific cases, but poor feedstock choices can erase benefits. Nuclear power is nonrenewable because it depends on mined fuel, yet its life cycle emissions are often closer to renewable electricity than to fossil generation.
How life cycle analysis compares renewable and nonrenewable resources
Life cycle analysis begins by defining a functional unit, such as one kilowatt-hour of electricity, one megajoule of fuel, or one kilometer traveled. It then sets system boundaries. A cradle-to-grave study includes extraction, processing, manufacturing, use, and disposal. A cradle-to-gate study stops at the factory gate. Standards from ISO 14040 and ISO 14044 guide inventory analysis, impact assessment, interpretation, allocation choices, and sensitivity testing. In practice, the credibility of an LCA often depends on electricity mix assumptions, operating lifetime, capacity factor, transport distance, and end-of-life treatment. For example, the same battery can look cleaner or dirtier depending on whether manufacturing occurs on a coal-heavy grid or a low-carbon grid.
Environmental scientists compare renewable and nonrenewable resources across several impact categories. Climate change potential is the most cited metric, reported as grams of carbon dioxide equivalent per kilowatt-hour. Other important categories include particulate pollution, sulfur dioxide formation, eutrophication, freshwater ecotoxicity, mineral resource scarcity, land occupation, and blue water consumption. Energy return on investment also matters, because a system that produces far more energy than it consumes is easier to scale. I recommend treating no single metric as sufficient. Coal can be judged not only by high carbon intensity but also by mercury emissions, ash disposal, and respiratory health damage. Solar can be judged not only by low operating emissions but also by material sourcing, manufacturing energy, and panel recycling pathways.
| Technology | Resource Type | Typical life cycle greenhouse gas emissions | Key life cycle concerns |
|---|---|---|---|
| Coal power | Nonrenewable | High, often around 800 to 1000 g CO2e/kWh | Mining damage, methane, air pollution, ash waste |
| Natural gas power | Nonrenewable | Moderate to high, often around 400 to 550 g CO2e/kWh | Methane leakage, combustion emissions, water use |
| Solar photovoltaics | Renewable | Low, often around 20 to 60 g CO2e/kWh | Silicon processing, metals, recycling, land use |
| Onshore wind | Renewable | Very low, often around 8 to 20 g CO2e/kWh | Steel and concrete inputs, siting, blade disposal |
| Hydropower | Renewable | Low to variable, often around 5 to 100 g CO2e/kWh | Reservoir methane, habitat change, sediment impacts |
| Geothermal | Renewable | Low, often around 10 to 50 g CO2e/kWh | Drilling impacts, brine management, induced seismicity |
These ranges vary across studies, but the ranking is stable. Reviews associated with the Intergovernmental Panel on Climate Change and the National Renewable Energy Laboratory consistently show that most renewable electricity technologies have substantially lower life cycle emissions than fossil generation. That does not mean every project is equal. A tropical reservoir can release significant methane from decomposing biomass. A solar array built with high-emission electricity and short lifespan performs worse than one built with cleaner power and long service life. Good LCA does not flatten these differences; it explains them.
Renewable resource technologies: strengths, limits, and material footprints
Solar photovoltaics illustrate why life cycle analysis is superior to simple labels. Crystalline silicon modules dominate the market. Their impacts are concentrated in energy-intensive purification, wafer slicing, cell processing, glass, aluminum framing, and inverter production. Yet once installed, they generate electricity for twenty five to thirty five years with no fuel combustion. In field assessments, the carbon payback period is often only a few years, after which the system provides net climate benefits. Thin-film technologies use different materials and can lower certain manufacturing burdens, but they may raise different supply chain questions. Recycling is becoming more important as first-generation utility projects reach retirement age.
Wind power, especially onshore wind, is one of the strongest performers in LCA studies. Most impacts come from steel towers, concrete foundations, fiberglass or composite blades, copper wiring, installation, and maintenance logistics. During operation, emissions are minimal. Wind’s main challenges are not carbon intensity but variability, local siting conflicts, transmission needs, and blade end-of-life management. I have seen projects delayed less by life cycle concerns than by landowner agreements, avian risk studies, and grid interconnection queues. Offshore wind has higher material and installation burdens than onshore wind, but it can deliver stronger capacity factors and reduce land-use conflict in densely populated regions.
Hydropower and geothermal require more careful interpretation. Hydropower can have extremely low operational emissions, but reservoirs alter river ecology, fish passage, sediment transport, and surrounding land use. In warm climates, flooded vegetation can generate methane, raising life cycle emissions. Run-of-river systems may reduce reservoir effects but can still disrupt habitats. Geothermal plants usually score well on climate metrics because they tap a renewable heat flow, yet drilling, well casing, brine chemistry, and reinjection management influence outcomes. Enhanced geothermal systems also raise legitimate concerns about induced seismicity. These technologies remain valuable, but they show that renewable does not automatically mean impact-free.
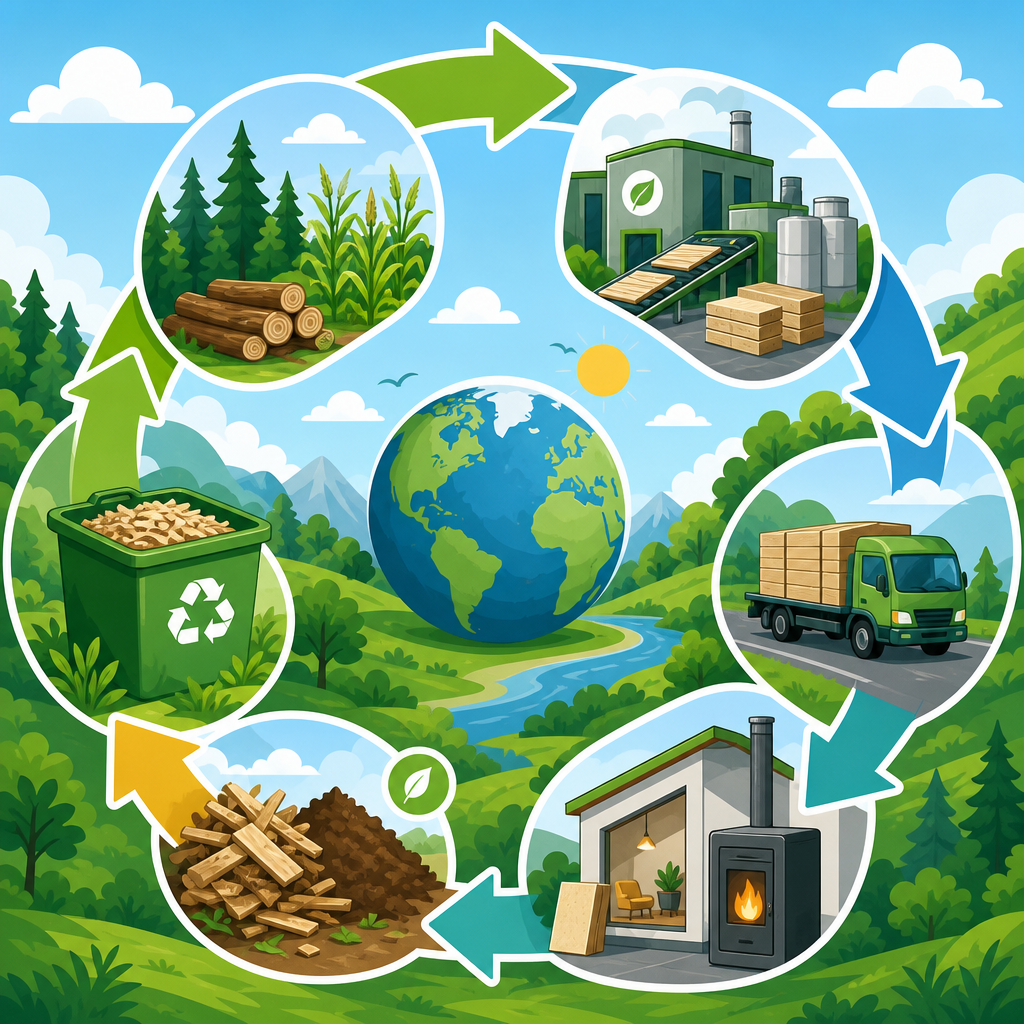
Biomass is the most misunderstood renewable resource in this debate. Wood pellets, crop residues, landfill gas, anaerobic digestion, and dedicated energy crops all fall under biomass, but their life cycle performance differs dramatically. Residues that would otherwise decompose quickly or emit methane can produce meaningful benefits. Unsustainably harvested forests or energy crops replacing food production can create carbon debt, biodiversity loss, and fertilizer runoff. The timing of emissions matters. Carbon released now and recaptured decades later is not climate neutral in the near term. Any biomass claim should specify feedstock origin, counterfactual land use, transport distance, moisture content, and combustion efficiency.
Nonrenewable systems: why operational convenience masks larger burdens
Coal remains the clearest example of a high-impact nonrenewable resource. Across its life cycle, coal requires extraction, washing, transport, combustion, and ash disposal. Mining causes land disturbance, acid mine drainage, and worker safety risks. Combustion releases carbon dioxide, sulfur dioxide, nitrogen oxides, particulate matter, and trace metals such as mercury. Scrubbers and filters reduce some pollutants, but they do not erase the carbon burden or ash management problem. In public health terms, coal’s damage extends far beyond climate change. LCA captures those upstream and downstream costs, making it difficult to justify new coal infrastructure where alternatives are available.
Natural gas is often framed as a cleaner bridge fuel because gas turbines emit less carbon dioxide at the smokestack than coal plants. That comparison is incomplete. Methane, the main component of natural gas, is a potent greenhouse gas, and leakage from wells, processing plants, pipelines, and compressors can materially change life cycle results. Combined cycle gas plants can be efficient and responsive, which helps grid balancing, but their long-term climate compatibility depends on leakage control, limited operating hours, or carbon capture that works in practice. Oil faces similar life cycle scrutiny, especially in transportation, where refining energy, flaring, spills, and combustion dominate environmental burdens.
Uranium occupies a special place in renewable versus nonrenewable discussions. It is nonrenewable because the fuel is mined and finite, but nuclear electricity often shows low life cycle greenhouse gas emissions comparable to wind and lower than gas. Most impacts arise from uranium mining and milling, fuel enrichment, plant construction, and decommissioning. The persistent concerns are accident risk, long-lived radioactive waste, water use for cooling, and project cost overruns. An evidence-based hub should present nuclear accurately: it is not renewable, but it is also not equivalent to fossil fuels on life cycle climate terms.
Choosing better systems: policy, design, and consumer decisions
The practical lesson from life cycle analysis is not merely that renewables are cleaner overall. It is that outcomes improve when technology choice, location, supply chain, and end-of-life planning are integrated from the start. Policymakers can prioritize grids with high shares of wind, solar, geothermal, and well-sited hydro while investing in transmission, storage, demand response, and efficiency. Engineers can lower impacts by using recycled aluminum, low-carbon steel, longer-lived components, and modular designs that support repair. Manufacturers can publish environmental product declarations and design for disassembly. Utilities can retire coal first, cut methane leakage, and avoid locking in fossil assets with multi-decade emissions trajectories.
For consumers and organizations, the best comparison is rarely abstract. It is contextual. A rooftop solar system paired with a heat pump may sharply cut household emissions in a region with a fossil-heavy grid. In another location, community solar or efficiency retrofits may deliver greater benefit per dollar. Electric vehicles usually have higher manufacturing impacts than gasoline cars because of battery production, but lower operating emissions often outweigh that difference over the vehicle lifetime, especially on cleaner grids. The same principle applies across this subtopic: ask about the full life cycle, not just the purchase moment or the visible operation stage.
As the hub for renewable versus nonrenewable resources, this article establishes a clear rule for evaluating every related technology: compare equal services over complete life cycles using transparent assumptions. Renewable resource technologies usually provide decisive advantages on greenhouse gas emissions and air pollution, while nonrenewable systems tend to impose larger long-term climate and health burdens. The exceptions and tradeoffs are real, particularly for biomass, hydropower reservoirs, mining impacts, and recycling challenges, but they do not overturn the overall pattern. If you want better environmental decisions, use life cycle analysis as the starting point, then follow the evidence into each specific resource, technology, and policy choice.
Frequently Asked Questions
What is life cycle analysis, and why is it important for renewable resource technologies?
Life cycle analysis, or LCA, is a structured method used to measure the total environmental impact of a technology from beginning to end. For renewable resource technologies, that means looking beyond the fact that a solar panel, wind turbine, hydropower facility, biomass system, or geothermal plant can generate low-carbon energy during operation. A full LCA examines raw material extraction, manufacturing, transportation, installation, operation, maintenance, repair, replacement of major components, and end-of-life processing such as recycling, disposal, or reuse.
This approach matters because environmental performance cannot be judged accurately by operational emissions alone. A wind turbine may produce electricity without burning fuel, but it still requires steel, concrete, rare earth elements, transport logistics, and eventual decommissioning. Solar modules require silicon processing, glass, metals, and energy-intensive manufacturing steps. Biomass systems can appear renewable, but their total impact depends heavily on land use, feedstock sourcing, fertilizer use, transport distances, and combustion emissions. LCA provides the measurable framework needed to compare these realities fairly.
In practice, LCA helps policymakers, researchers, businesses, and the public separate marketing claims from verified environmental outcomes. It can identify which renewable technologies have the lowest greenhouse gas emissions per unit of electricity, heat, or fuel, and it can also reveal tradeoffs involving water use, mineral demand, habitat disruption, air pollution, waste generation, and land occupation. That makes LCA one of the most practical and credible tools for comparing clean energy systems on scientific terms rather than assumptions.
What stages are typically included in the life cycle analysis of renewable energy systems?
A comprehensive life cycle analysis usually begins with raw material extraction. This includes mining metals, producing cement, harvesting biomass feedstocks, manufacturing polymers, or sourcing specialized materials used in turbines, panels, pipelines, generators, batteries, and support structures. The environmental burdens at this stage can include energy consumption, greenhouse gas emissions, land disturbance, water use, and pollution associated with extraction and processing.
The next major stage is manufacturing and assembly. For renewable resource technologies, this often includes refining silicon for solar cells, fabricating turbine blades and towers, constructing hydropower equipment, building geothermal drilling components, or preparing biomass conversion systems. Manufacturing can be one of the most impactful phases, especially when production relies on carbon-intensive electricity or high-temperature industrial processes. Transport is also considered, because moving large equipment across long distances adds fuel use and emissions.
After manufacturing comes installation and construction, which may involve heavy equipment, civil engineering, road building, transmission connections, foundations, dams, drilling operations, or grid integration infrastructure. Then comes the operation phase, where the technology generates electricity or useful energy. For solar and wind, operational emissions are typically very low, while biomass may involve direct combustion emissions and ongoing feedstock transport. Maintenance is another important stage, especially for systems that require replacement parts, lubricants, cleaning, repairs, inverter replacement, blade servicing, or well management.
Finally, the analysis includes end-of-life treatment. This stage examines whether materials are recycled, landfilled, incinerated, repurposed, or recovered for secondary use. End-of-life assumptions can significantly change results, especially for technologies with high-value metals or difficult-to-process composite materials. Depending on the study goal, the LCA may also include avoided burdens, such as recycling credits or displaced fossil fuel generation. The exact boundaries vary, but the strongest LCAs clearly define every stage and justify what is included or excluded.
Do all renewable resource technologies have the same environmental footprint?
No, and that is one of the main reasons life cycle analysis is so valuable. Renewable resource technologies differ significantly in their materials, land needs, infrastructure requirements, operating profiles, and end-of-life challenges. Even within the same category, impacts can vary widely depending on design choices, geographic conditions, supply chains, and how the system is managed over time.
For example, wind and solar technologies generally have low life cycle greenhouse gas emissions compared with fossil fuel systems, but their environmental profiles are not identical. Wind farms often require substantial steel and concrete, and their impacts may include visual change, land use considerations, and localized wildlife concerns such as bird and bat collisions. Solar systems can involve energy-intensive manufacturing and material inputs, with differences between rooftop systems and utility-scale installations affecting land occupation and balance-of-system requirements. Hydropower can provide long-lived, low-carbon electricity, but some projects can alter river ecosystems, affect fish passage, flood land, and in certain climates create methane emissions from reservoirs.
Biomass is especially complex because its sustainability depends on how the fuel is sourced. Residues and wastes may perform quite differently from purpose-grown energy crops. Unsustainable harvesting, fertilizer-heavy cultivation, long transport distances, and land conversion can make some biomass pathways much more environmentally burdensome than expected. Geothermal systems can also vary based on drilling depth, geology, water management, and whether emissions of underground gases are effectively controlled. LCA reveals these distinctions and helps avoid the mistake of treating all renewable technologies as environmentally equivalent simply because they rely on replenishable resources.
What metrics are used in life cycle analysis to compare renewable technologies?
The most widely recognized metric is life cycle greenhouse gas emissions, often expressed as grams of carbon dioxide equivalent per kilowatt-hour of electricity generated. This allows different technologies to be compared on a common basis. It captures not only carbon dioxide, but also other greenhouse gases such as methane and nitrous oxide, converted into a common warming impact measure. For many readers, this is the most direct way to understand how low-carbon a renewable system truly is over its entire life span.
However, a robust LCA goes far beyond carbon. It may assess cumulative energy demand, water consumption, land use, mineral and metal depletion, acidification, eutrophication, particulate emissions, human toxicity, ecosystem toxicity, and waste generation. Some studies also evaluate resource circularity, recyclability, and dependence on critical materials. These metrics matter because a technology with excellent climate performance could still create pressure on water resources, landscapes, or supply chains if deployed at large scale without careful planning.
Functional unit selection is also critical. Most energy LCAs compare impacts per kilowatt-hour of electricity, per megajoule of fuel, or per unit of useful heat delivered. This ensures the comparison reflects the same service provided by each technology. Capacity factor, operating life, conversion efficiency, and system boundaries all influence the final result. For that reason, two studies on the same technology may report different values if they use different assumptions. The best interpretation is not to focus on a single number in isolation, but to understand the broader pattern of impacts and the assumptions behind the metrics.
What are the main limitations of life cycle analysis when evaluating renewable resource technologies?
Life cycle analysis is one of the strongest environmental assessment tools available, but it is not perfect. One major limitation is data quality. LCAs depend on large datasets covering materials, energy use, transport, maintenance, and end-of-life treatment. If those inputs are outdated, regionally mismatched, incomplete, or based on generic industry averages, the final results may not reflect the actual performance of a specific project or technology. This is especially important in rapidly evolving sectors such as solar manufacturing, battery production, and recycling systems, where processes can improve quickly.
Another challenge is the choice of system boundaries and assumptions. Researchers must decide what to include, what to exclude, how to allocate impacts among co-products, how long the equipment lasts, how much energy it produces over time, and what happens at end of life. Small methodological differences can noticeably affect outcomes. For biomass in particular, assumptions about land-use change, carbon accounting, regrowth timing, and feedstock sourcing can lead to very different conclusions. Hydropower assessments can also be sensitive to local ecological factors and reservoir emission estimates.
LCA also does not automatically capture every social, ecological, or ethical issue. It may quantify emissions and resource use very well, while being less capable of fully representing biodiversity loss, local community disruption, labor conditions, Indigenous land rights, or geopolitical risks tied to critical minerals. Those issues often require complementary tools such as environmental impact assessment, social life cycle assessment, or broader sustainability analysis. In other words, LCA is essential for evidence-based comparison, but it works best as part of a larger decision-making framework rather than as the only test of whether a renewable technology is truly sustainable.