Breakthroughs in ocean exploration and climate mapping are reshaping how scientists understand Earth’s most dynamic system and how societies prepare for a warmer, less predictable future. Ocean exploration refers to the tools, missions, and methods used to observe seafloor geology, water chemistry, currents, ecosystems, and deep-ocean processes. Climate mapping is the practice of measuring and visualizing patterns such as sea-surface temperature, salinity, carbon storage, ice loss, storm intensity, and long-term circulation change across time and space. Together, these fields form the backbone of modern environmental science because the ocean absorbs more than 90 percent of the excess heat trapped by greenhouse gases and roughly a quarter of human carbon dioxide emissions, while also governing rainfall, fisheries, coastal risk, and global weather.
I have worked with marine datasets and remote-sensing workflows long enough to know that the biggest shift is not just better imagery or bigger models. The real breakthrough is integration. Twenty years ago, researchers often studied bathymetry, biology, atmospheric forcing, and climate trends in separate silos. Today, autonomous vehicles, satellites, floats, acoustic sensors, and machine-learning systems are linked into observing networks that can track what is happening from the sea surface to abyssal plains. That matters because ocean change is not a single variable problem. A marine heatwave, for example, is influenced by wind patterns, vertical mixing, background warming, and local ecosystem sensitivity, and each of those factors must be mapped together.
This sub-pillar hub on research and discoveries explains the core advances driving ocean exploration and climate mapping, the instruments behind the data, and the practical value for conservation, forecasting, shipping, energy, and coastal planning. It also highlights where knowledge gaps remain. Despite major progress, most of the seafloor is still only coarsely mapped, deep biological communities remain under-sampled, and polar observations are limited by extreme conditions. Understanding recent breakthroughs requires looking at how measurement technology, data science, and climate interpretation now work as one system.
Why ocean exploration and climate mapping now move together
Ocean exploration and climate mapping used to be presented as separate disciplines, but in current research they are deeply interdependent. Seafloor mapping reveals submarine canyons, ridges, vents, and sediment pathways that influence circulation, carbon burial, and habitat distribution. At the same time, climate mapping shows how heat content, stratification, oxygen loss, and acidification are changing the physical and chemical environment around those features. A map of the seafloor without water-column change is incomplete, and a climate map without ocean structure misses the mechanisms shaping regional outcomes.
A clear example is the Atlantic Meridional Overturning Circulation, often discussed in relation to European climate and global heat transport. Researchers do not assess its state from one type of observation alone. They combine moored instruments, Argo float profiles, satellite altimetry, gravimetry, and surface flux data. Similar integration is used to understand coral reef stress. Reef health now depends on high-resolution maps of sea-surface temperature anomalies, local current refuges, water clarity, and ecological surveys. This joined-up approach lets scientists identify not only where damage occurred but why one reef bleached while another nearby survived.
The same logic applies to policy and industry. Offshore wind developers need seabed characterization, current mapping, storm-return estimates, and sediment transport forecasts. Fisheries managers need species distribution data tied to temperature fronts, oxygen minimum zones, and primary productivity. Emergency planners need storm surge models informed by bathymetry and sea-level rise projections. In other words, the strongest environmental science research now connects exploration data with climate intelligence in ways that support decisions on the ground and at sea.
New tools transforming research and discoveries at sea
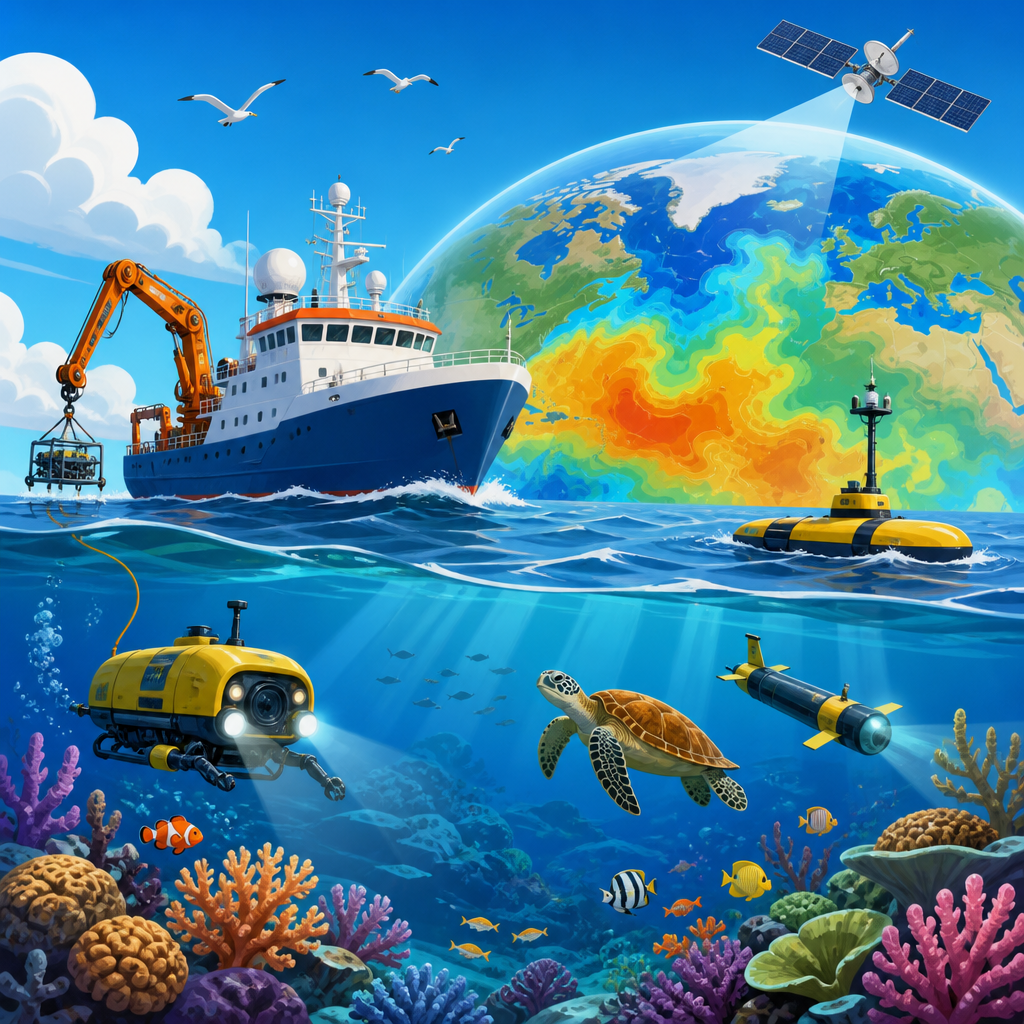
The largest gains in ocean research and discoveries have come from platforms that collect persistent, high-resolution data in places ships alone cannot cover. Multibeam echo sounders remain fundamental for bathymetric mapping, sending fan-shaped acoustic pulses to measure seafloor depth and texture. Modern systems mounted on research vessels can produce detailed terrain models that reveal landslides, pockmarks, seamounts, and fracture zones. Side-scan sonar adds imagery-like texture for identifying wrecks, habitats, and sediment patterns. These acoustic methods are the standard for serious seabed science.
Autonomous underwater vehicles and remotely operated vehicles extend that reach. AUVs can fly close to the seabed with cameras, chemical sensors, and synthetic aperture sonar, producing much finer maps than hull-mounted instruments. ROVs add manipulator arms and live video, allowing direct sampling of corals, vent minerals, microbes, and sediments at depth. In my experience, nothing changes interpretation faster than pairing broad acoustic maps with targeted visual transects. Features that initially look geologic sometimes turn out to host dense biological assemblages, while apparent habitat continuity may break sharply due to subtle chemistry or current shifts.
On the climate side, Argo floats have been revolutionary. The international Argo program deploys profiling floats that drift, dive, and resurface every several days, measuring temperature and salinity through the upper two thousand meters. Biogeochemical Argo floats now add dissolved oxygen, nitrate, pH, chlorophyll fluorescence, and particle backscatter, making them essential for mapping deoxygenation, acidification, and carbon cycling. Satellite missions complement this in different ways: altimeters measure sea-surface height, scatterometers estimate wind, radiometers track sea-surface temperature, and ocean color sensors infer phytoplankton biomass through chlorophyll signals.
Data integration platforms are the quieter but equally important breakthrough. NOAA, the European Copernicus Marine Service, EMODnet, GEBCO, NASA Earthdata, and the Schmidt Ocean Institute all support open access to observations that were once difficult to obtain. Cloud computing and geographic information systems now let researchers combine vessel tracks, float records, reanalysis products, and habitat layers into one workflow. The result is faster hypothesis testing, better reproducibility, and much more usable ocean science.
Breakthrough discoveries changing what scientists know
Recent exploration has overturned assumptions about how much of the ocean remains functionally unknown. Deep-sea expeditions continue to discover new species, but the larger story is ecological complexity. Hydrothermal vent systems now reveal microbial communities that metabolize sulfur, methane, iron, and hydrogen in ways that redefine the lower limits of life. Cold-water coral reefs, once thought sparse, are now mapped across continental margins from the North Atlantic to the Southern Ocean. These habitats support fish nurseries and biodiversity hotspots even in dark, cold conditions.
Geologic discoveries are just as important for climate mapping. Submarine landslides and methane seep fields affect carbon cycling, hazard assessment, and seafloor stability. Mapping of blue carbon systems such as mangroves, seagrasses, and salt marshes has also improved sharply. Researchers can now estimate how coastal ecosystems store carbon in sediments and where restoration produces the highest climate benefit. This matters because not all carbon sequestration projects are equal; sediment type, hydrodynamics, and disturbance history strongly influence permanence.
Another breakthrough is the identification and tracking of marine heatwaves. Studies published over the last decade show that these prolonged warm events have become more frequent, longer lasting, and more intense in many ocean basins. The Northeast Pacific “Blob” provided a widely cited example, disrupting food webs, shifting fish distributions, and contributing to harmful algal blooms. Better mapping of subsurface heat content now helps scientists distinguish short-lived surface anomalies from deeper, ecosystem-scale thermal stress. That distinction improves fisheries forecasts and reef risk assessment.
| Breakthrough area | What changed | Why it matters |
|---|---|---|
| Seafloor mapping | Higher-resolution multibeam and AUV surveys | Improves habitat maps, hazard analysis, and infrastructure planning |
| Autonomous profiling | Argo and biogeochemical floats expanded beyond temperature and salinity | Reveals oxygen loss, acidification, and carbon-cycle change |
| Satellite observation | Better altimetry, ocean color, and thermal products | Tracks heat, currents, productivity, and sea-level trends globally |
| Deep-ocean ecology | More direct imaging and sampling of vents, corals, and abyssal habitats | Shows biodiversity and ecosystem function are richer than assumed |
| Climate event detection | Integrated mapping of marine heatwaves and circulation anomalies | Supports early warning for fisheries, reefs, and coastal economies |
How climate mapping works in practice
Climate mapping is often misunderstood as drawing colored maps from satellite images, but the operational process is far more rigorous. Scientists start with observations from multiple platforms, then quality-control them, correct biases, and assimilate them into numerical models or gridded products. Sea-surface temperature from satellites, for instance, must be adjusted for cloud contamination, sensor drift, and differences between skin temperature and bulk water temperature. Subsurface profiles from floats and moorings then anchor those surface readings in the real three-dimensional ocean.
From there, researchers build climatologies and anomaly maps. A climatology is the expected average state over a standard reference period, commonly thirty years. An anomaly shows how current conditions differ from that baseline. That sounds straightforward, but baseline choice matters. A recent normal can mask long-term warming, while an older normal can exaggerate present departures. Good climate mapping states the reference period clearly and explains uncertainty. The same standard applies to sea-level maps, sea-ice concentration trends, oxygen decline, and storm-track shifts.
Machine learning is now widely used, but it works best as an enhancement rather than a replacement for physics-based interpretation. Neural networks can fill gaps in sparse chlorophyll or salinity fields and detect patterns in acoustic imagery, yet they can also amplify bias if training data are uneven. The most reliable workflows combine algorithmic speed with expert review, benchmarked against in situ observations. In my own projects, the strongest results have always come from checking model outputs against mooring records, shipboard CTD casts, and region-specific process knowledge before drawing conclusions.
High-value outputs from climate mapping include marine heatwave alerts, coastal flood exposure maps, ocean acidification hotspots, and probabilistic storm-surge projections. These products are useful only when spatial resolution matches the decision. A global half-degree grid may be fine for basin trends, but port engineering, estuary restoration, and reef conservation often require kilometer-scale or finer analysis. Scale is not a technical detail; it determines whether a map is merely descriptive or operationally useful.
Applications for conservation, forecasting, and the blue economy
Breakthroughs in ocean exploration and climate mapping are valuable because they improve decisions. Marine protected area design increasingly uses habitat suitability models built from bathymetry, temperature, current exposure, and species observations. Instead of drawing boundaries around what is already visible, managers can identify climate refugia, spawning grounds, migration corridors, and vulnerable deep-sea habitats before damage occurs. This approach is more defensible scientifically and more efficient politically because it links conservation measures to measurable ecological outcomes.
Weather and seasonal forecasting also benefit. Tropical cyclone intensity depends heavily on upper-ocean heat content, not just surface temperature, so improved subsurface mapping can sharpen intensity estimates. El Niño and La Niña forecasts rely on monitoring equatorial Pacific heat buildup, thermocline depth, and wind stress. Better ocean observing networks therefore improve agriculture planning, drought preparedness, and disaster response far beyond the coastline. Ocean data are climate infrastructure.
Commercial uses are expanding as well. Shipping companies use current and wave maps to optimize routes, cut fuel use, and reduce risk. Offshore energy developers depend on seabed surveys, metocean statistics, and scour forecasts. Aquaculture operators monitor oxygen, temperature, and harmful algal bloom indicators to avoid stock losses. Insurance and finance increasingly incorporate flood maps, sea-level rise scenarios, and storm-return data into asset valuation. The blue economy works best when environmental mapping is treated as a decision system, not a static archive.
Still, tradeoffs must be acknowledged. Exploration can be expensive, deep-sea mining raises serious ecological concerns, and not every model is equally reliable in every region. Data-poor coastlines, especially in parts of Africa, the Pacific Islands, and the polar seas, remain underrepresented. The next phase of progress depends on sustained observing programs, open standards, and partnerships that give local researchers access to tools, training, and authorship.
What comes next for environmental science research
The next decade will focus less on isolated discoveries and more on closing coverage gaps and turning observations into faster action. Seabed 2030 aims to compile a complete map of the global ocean floor, a goal that would improve tsunami modeling, cable routing, habitat assessment, and basic Earth system science. Deep Argo floats are extending measurements below two thousand meters, where large amounts of heat are stored but still under-sampled. Under-ice robots and polar satellites are improving measurements in some of the hardest places on Earth to observe, including the Southern Ocean, which plays an outsized role in carbon uptake and deep-water formation.
Another major shift is near-real-time synthesis. Digital twins of the ocean, coupled Earth system models, and continuously updated marine dashboards are making it possible to move from retrospective analysis toward operational prediction. That change will help cities manage coastal flooding, help fisheries respond to shifting stocks, and help researchers detect abrupt change earlier. For anyone following environmental science, the central lesson is clear: better ocean exploration leads to better climate mapping, and better climate mapping leads to smarter environmental decisions. Explore the linked research areas within this hub to go deeper into marine technology, biodiversity discovery, carbon cycling, and coastal resilience.
Frequently Asked Questions
What are the most important recent breakthroughs in ocean exploration and climate mapping?
Some of the most significant breakthroughs come from the way scientists now combine advanced sensing technologies with large-scale data analysis. Autonomous underwater vehicles, remotely operated vehicles, deep-sea gliders, and instrumented buoys can now collect detailed measurements from parts of the ocean that were once extremely difficult to monitor. These tools gather information on seafloor structure, water temperature, salinity, oxygen levels, nutrient concentrations, current patterns, and even biological activity in the deep ocean. At the same time, satellites are providing increasingly precise measurements of sea-surface height, temperature, ocean color, sea ice extent, and coastal change, allowing researchers to connect local observations with global climate patterns.
Another major breakthrough is the integration of ocean data into climate mapping systems that update more frequently and at much higher resolution than older models. Scientists can now visualize changes in heat storage, carbon absorption, ice melt, storm development, and circulation shifts with much greater clarity. This matters because the ocean absorbs most of the excess heat trapped by greenhouse gases and stores a large share of human-produced carbon dioxide. Better maps of these processes help researchers detect early warning signs of climate disruption, identify marine heatwaves, track changes in fisheries habitat, and improve projections for sea-level rise and extreme weather. In short, the biggest leap is not just better tools, but the ability to connect exploration and climate mapping into one evolving picture of how the planet works.
How does ocean exploration improve our understanding of climate change?
Ocean exploration is essential to climate science because the ocean is one of the main regulators of Earth’s climate system. It moves heat around the planet through major current systems, absorbs carbon dioxide from the atmosphere, and influences rainfall, storms, and long-term temperature patterns. Without direct measurements from the surface to the deep ocean, scientists would have an incomplete understanding of where heat is going, how quickly the seas are changing, and what those changes mean for weather and ecosystems. Exploration missions help reveal how warm water penetrates deeper layers, how polar waters are shifting, and how seafloor and coastal environments respond to warming, acidification, and oxygen loss.
These observations also improve climate models by replacing assumptions with real-world evidence. For example, when researchers measure deep-ocean currents, melting near ice shelves, or carbon stored in different layers of seawater, they can refine forecasts for sea-level rise, storm intensity, and ecosystem stress. Ocean exploration also helps identify tipping points, such as coral reef collapse, weakening circulation systems, or expanding low-oxygen zones. Because climate change does not affect every region in the same way, detailed exploration allows scientists to map where impacts are accelerating and where resilience may still exist. That makes ocean exploration not just a scientific pursuit, but a practical foundation for climate planning, conservation, and risk reduction.
What technologies are used to map the ocean and monitor climate patterns?
Modern ocean and climate mapping depends on a layered network of technologies, each designed to capture a different part of the system. Satellites provide broad, repeated coverage of the ocean surface, measuring variables such as sea-surface temperature, wave height, sea level, ice cover, and ocean color, which can indicate plankton productivity. Argo floats and related profiling systems drift through the ocean and periodically dive below the surface before resurfacing to transmit data on temperature and salinity. Gliders travel for long distances while collecting detailed profiles of the water column, and moored instruments continuously record conditions in fixed locations. Research vessels still play a critical role by deploying sensors, collecting water samples, mapping the seafloor with sonar, and conducting specialized experiments that autonomous tools cannot perform alone.
For deeper and more complex environments, scientists use remotely operated vehicles and autonomous underwater vehicles equipped with cameras, sonar, chemical sensors, and robotic arms. These systems can investigate hydrothermal vents, submarine canyons, methane seeps, and fragile deep-sea ecosystems while also collecting high-resolution geological and chemical data. In climate mapping, supercomputers and machine learning tools are increasingly used to merge observations from all these platforms into dynamic models and visual maps. This integration allows scientists to spot trends that might otherwise remain hidden, such as subtle shifts in ocean circulation, the spread of marine heatwaves, or changes in carbon uptake. The result is a much richer and more actionable understanding of both the physical ocean and its role in the global climate system.
Why is climate mapping of the oceans so important for communities, industries, and governments?
Climate mapping turns complex ocean data into information that people can use to make decisions. For coastal communities, these maps can show where sea-level rise, erosion, saltwater intrusion, and flood risk are increasing. For emergency planners, improved climate maps can support better forecasts of hurricane intensification, storm surge exposure, and shifting rainfall patterns. For fisheries, shipping, tourism, and offshore energy sectors, ocean maps help identify changing water conditions, habitat movement, dangerous weather, and infrastructure vulnerability. Because so much of the global economy depends on stable coastlines and predictable marine conditions, accurate ocean-climate mapping has become a practical necessity rather than a purely scientific exercise.
Governments also rely on these insights for long-term adaptation and policy planning. Climate maps can guide where to strengthen ports, protect wetlands, update flood defenses, or restrict development in high-risk areas. They also inform marine protected area design, carbon management strategies, and international negotiations over climate resilience and ocean governance. Importantly, climate mapping helps shift responses from reactive to preventive. Instead of waiting for visible damage, communities and institutions can prepare based on measurable trends in warming, circulation changes, or ice loss. In that sense, ocean climate mapping serves as both an early warning system and a planning tool for living in a warmer, less predictable world.
What challenges still limit ocean exploration and climate mapping, and what comes next?
Despite major progress, large parts of the ocean remain poorly observed, especially the deep sea, polar regions, and remote areas far from shipping routes and research infrastructure. Harsh conditions, extreme pressure, limited battery life, high operational costs, and the sheer size of the ocean make continuous monitoring difficult. Data gaps remain a serious issue because climate processes often unfold over long timescales and across vast distances. Another challenge is turning huge volumes of measurements into standardized, shareable, and interpretable information. Different instruments, countries, and research programs may collect data in different ways, and integrating those data into coherent climate maps requires strong international coordination.
Looking ahead, the next phase will likely involve denser observing networks, smarter autonomous systems, better deep-ocean coverage, and more powerful predictive models. Scientists are working on longer-lasting robotic platforms, improved sensors for carbon and biological processes, and near-real-time mapping systems that can support rapid decision-making. There is also growing interest in linking ocean exploration more closely with biodiversity monitoring, hazard forecasting, and climate adaptation planning. As technology advances, researchers will be able to capture not only where ocean change is happening, but how quickly it is unfolding and which regions are most vulnerable. That future will make ocean exploration and climate mapping even more central to understanding Earth’s changing climate and protecting the societies that depend on healthy, stable seas.